Abstract
Charts are a crucial visual medium for communicating and representing information. While Large Vision-Language Models (LVLMs) have made progress on chart question answering (CQA), the task remains challenging, particularly when models attend to irrelevant regions of the chart. In this work, we present ChartGaze, a new eye-tracking dataset that captures human gaze patterns during chart reasoning tasks. Through a systematic comparison of human and model attention, we find that LVLMs often diverge from human gaze, leading to reduced interpretability and accuracy. To address this, we propose a gaze-guided attention refinement that aligns image-text attention with human fixations. Our approach improves both answer accuracy and attention alignment, yielding gains of up to 2.56 percentage points across multiple models. These results demonstrate the promise of incorporating human gaze to enhance both the reasoning quality and interpretability of chart-focused LVLMs.
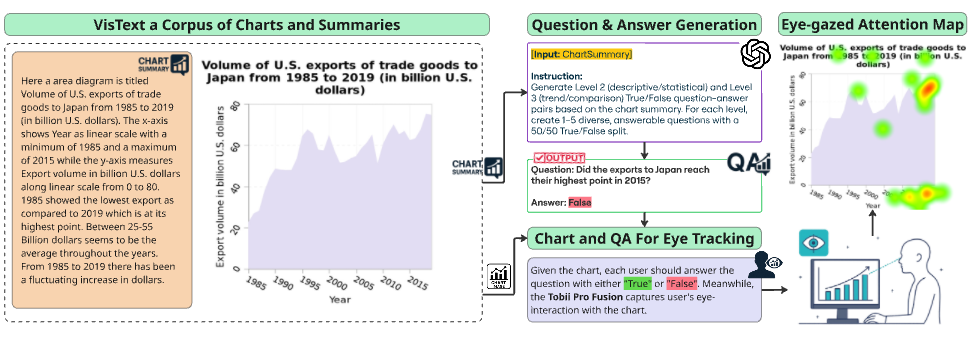
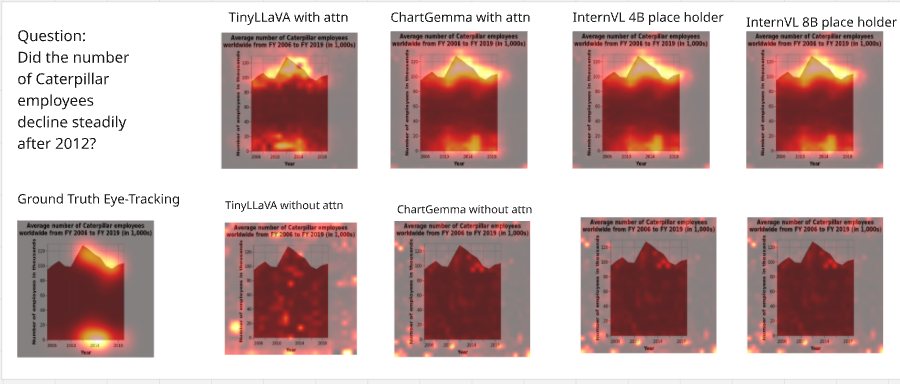
We introduce ChartGaze, a new eye-tracking dataset pairing chart images with human gaze recordings collected during chart question answering. Participants viewed charts on a calibrated eye-tracker setup while answering reasoning questions, yielding fine-grained fixation maps that capture where humans look when interpreting visual data.
The dataset spans multiple chart types and question categories (trend analysis, value extraction, comparison, etc.) and includes quality-controlled gaze maps paired with verified question-answer pairs.
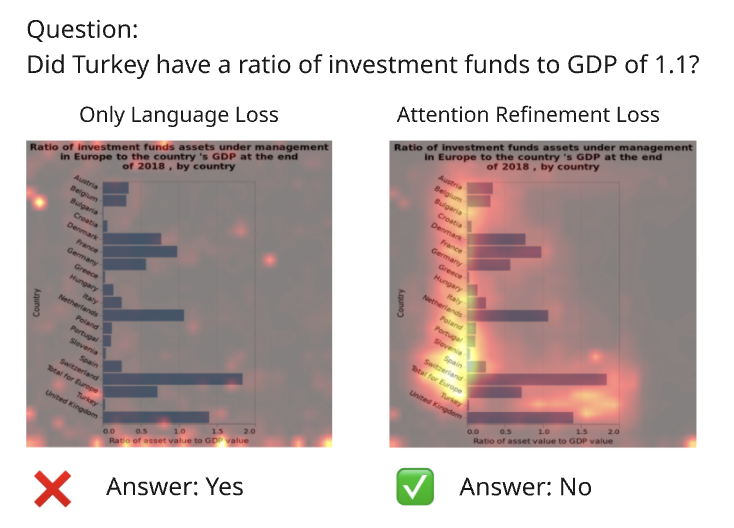
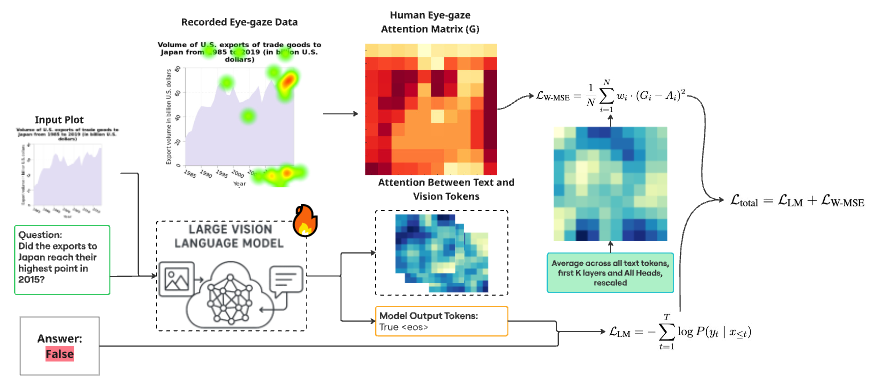
We propose a training-time attention refinement that minimizes the divergence between a model's image-text cross-attention maps and the corresponding human gaze fixation maps. The key insight is that human gaze serves as a proxy for where relevant information lives in a chart; if a model's attention aligns with where humans look, it is more likely to focus on task-relevant content.
Key components:
- Attention extraction: We extract cross-attention maps from early transformer layers, which carry the most spatial information.
- Gaze supervision: Fixation maps are post-processed (Gaussian smoothed with parameter σ) to match the spatial resolution of attention maps.
- Combined loss: The standard language modeling loss is augmented with an attention alignment loss, guiding the model without sacrificing language generation quality.
Our gaze-guided refinement yields consistent improvements across four LVLMs on the ChartQA benchmark. Models fine-tuned with attention-guided loss outperform those trained with language loss alone, with gains of up to 2.56 pp in QA accuracy. Notably, gaze supervision also dramatically improves attention alignment (CC, KL, SIM), confirming that the model learns to attend to chart regions that matter.
| Training | Model | Test Acc. (%) | CC ↑ | KL ↓ | SIM ↑ |
|---|
| TinyLLaVA-450M | 46.64 | -0.078 | 1.810 | 0.267 |
| InternVL2-4B | 49.86 | -0.060 | 1.722 | 0.282 |
| InternVL2-8B | 50.93 | -0.054 | 1.681 | 0.296 |
| ChartGemma-3B | 52.39 | 0.100 | 1.559 | 0.323 |
| TinyLLaVA-450M | 62.58 ± 0.27 | -0.048 ± 0.005 | 1.705 ± 0.031 | 0.288 ± 0.004 |
| InternVL2-4B | 63.91 ± 0.20 | -0.028 ± 0.004 | 1.532 ± 0.010 | 0.301 ± 0.004 |
| InternVL2-8B | 65.36 ± 0.22 | -0.017 ± 0.003 | 1.487 ± 0.009 | 0.312 ± 0.004 |
| ChartGemma-3B | 72.49 ± 1.69 | 0.092 ± 0.004 | 1.594 ± 0.026 | 0.316 ± 0.003 |
| TinyLLaVA-450M | 63.77 ± 0.54 | 0.391 ± 0.007 | 1.132 ± 0.015 | 0.439 ± 0.002 |
| InternVL2-4B | 65.45 ± 0.23 | 0.402 ± 0.006 | 1.072 ± 0.008 | 0.451 ± 0.004 |
| InternVL2-8B | 67.92 ± 0.15 | 0.417 ± 0.006 | 1.036 ± 0.007 | 0.468 ± 0.005 |
| ChartGemma-3B | 72.67 ± 1.24 | 0.436 ± 0.011 | 1.033 ± 0.014 | 0.452 ± 0.005 |
Performance of models trained with and without gaze supervision. ↑ / ↓ indicates higher / lower is better. Underline = best within baseline group; bold = best overall.
We conduct four ablation studies on InternVL2-8B (unless otherwise noted) to validate design choices in ChartGaze.
Masked Inference: Does the model rely on human-attended regions?
We test whether gaze-supervised models truly depend on human-attended chart regions by blurring or masking those areas at inference. A model that merely mimics gaze patterns would not suffer; a model that genuinely uses those regions for reasoning would see large accuracy drops.
| Condition | Acc. ↑ | CC ↑ | KL ↓ | SIM ↑ |
|---|
| Unperturbed | 65.36 | -0.017 | 1.487 | 0.312 |
| Blur human gaze areas | 61.02 | -0.139 | 1.681 | 0.236 |
| Mask human gaze areas | 60.14 | -0.124 | 1.713 | 0.221 |
| Blur non-gaze areas | 64.10 | 0.112 | 1.392 | 0.298 |
| Mask non-gaze areas | 62.85 | 0.064 | 1.456 | 0.274 |
| Unperturbed | 67.92 | 0.417 | 1.036 | 0.468 |
| Blur human gaze areas | 60.84 | -0.174 | 1.794 | 0.201 |
| Mask human gaze areas | 59.92 | -0.152 | 1.752 | 0.188 |
| Blur non-gaze areas | 66.82 | 0.284 | 1.218 | 0.395 |
| Mask non-gaze areas | 63.72 | 0.203 | 1.314 | 0.356 |
Gaze-supervised models suffer a much larger accuracy drop (−7.08% blur, −8.00% mask) than language-only models (−4.34%, −5.22%), confirming that gaze supervision induces genuine semantic reliance on human-attended regions, not just visual mimicry.
Loss Function Comparison
We compare four loss functions for the attention alignment objective on TinyLLaVA-450M: weighted MSE (W-MSE), KL Divergence, Focal Loss, and Dice + BCE.
| Loss Function | Test Acc. ↑ | CC ↑ | KL ↓ | SIM ↑ |
|---|
| W-MSE (ours) | 64.53 | 0.386 | 1.145 | 0.438 |
| KL Divergence | 62.36 | 0.306 | 1.209 | 0.380 |
| Focal Loss | 61.06 | 0.339 | 1.188 | 0.388 |
| Dice + BCE | 60.41 | 0.194 | 4.174 | 0.183 |
Effect of Dataset Size
We evaluate gaze supervision under low-data settings (25%, 50%, 100% of ChartGaze) on InternVL2-8B with three seeds per condition. Accuracy gains from gaze supervision become more pronounced as data decreases, demonstrating the value of attention supervision in low-resource settings.
| Training Setup | Test Acc. ↑ | CC ↑ | KL ↓ | SIM ↑ |
|---|
| 25% data | 60.21 ± 0.73 | -0.045 ± 0.005 | 1.602 ± 0.012 | 0.274 ± 0.006 |
| 50% data | 63.58 ± 0.24 | -0.028 ± 0.004 | 1.530 ± 0.010 | 0.295 ± 0.005 |
| 100% data | 65.36 ± 0.22 | -0.017 ± 0.003 | 1.487 ± 0.009 | 0.312 ± 0.004 |
| 25% data | 64.07 ± 0.26 | 0.297 ± 0.008 | 1.174 ± 0.011 | 0.402 ± 0.006 |
| 50% data | 66.51 ± 0.20 | 0.396 ± 0.007 | 1.065 ± 0.009 | 0.454 ± 0.005 |
| 100% data | 67.92 ± 0.15 | 0.417 ± 0.006 | 1.036 ± 0.007 | 0.468 ± 0.005 |
Gaze Map Post-Processing: σ Sensitivity
We apply a Gaussian filter (σ) to gaze fixation maps before computing the attention loss. We train TinyLLaVA-450M with three σ values. σ = 40 achieves the best accuracy; σ = 80 inflates alignment metrics by spreading attention too broadly, hurting accuracy.
| Fixation σ | Test Acc. ↑ | CC ↑ | KL ↓ | SIM ↑ |
|---|
| 20 | 62.89 | 0.277 | 1.875 | 0.272 |
| 40 (ours) | 63.77 | 0.391 | 1.132 | 0.439 |
| 80 | 61.49 | 0.490 | 0.588 | 0.612 |
Citation
@inproceedings{salamatian-etal-2025-chartgaze, title = "{C}hart{G}aze: Enhancing Chart Understanding in {LVLM}s with Eye-Tracking Guided Attention Refinement", author = "Salamatian, Ali and Abaskohi, Amirhossein and Fan, Wan-Cyuan and Hossain, Mir Rayat Imtiaz and Sigal, Leonid and Carenini, Giuseppe", booktitle = "Proceedings of the 2025 Conference on Empirical Methods in Natural Language Processing", month = nov, year = "2025", address = "Suzhou, China", publisher = "Association for Computational Linguistics", pages = "12093--12113", doi = "10.18653/v1/2025.emnlp-main.607" }